For the longest time I have been wanting to have a small page dedicated to – some – of the activity that is going on in our lab. Our new website made this easier so here we go. I am not too sure of the layout just yet but with some time and patience I should be able to make it simple and clear enough. I intend this to be some kind of work-log but not quite as detailed: we don’t want to disclose all our secrets!
So, you’re probably wondering what type of information will be shared here? Pretty simple! I will basically present some of our test data about water blocks, radiators, pumps, kits,… I will also show some competitive data, and occasionally I will even show or talk about some of our upcoming/unreleased products and why not some overclocking and benchmarks!
Tab 1
4/15/2011: Swiftech MCR220-XP Test Data

We've tested the upcoming
Swiftech MCR220-XP and we've decided to share its performance. Before I go any further, let me say up front that this radiator will please anyone who runs its fans above 1,500 RPM. It even outperforms most radiators in the 2,000 RPM range. If you never run your fans above 1,200 however, the
Quiet Power series such as the
MCR220-QP will do a better job.
To see all 6 charts
click here. But I have chosen the one on the left to illustrate the results. Why? Because it gives a lot of information very quickly and also because this type of chart is pretty much NEVER used by independent reviewers to compare radiators. All it does is show what is the effect of Air Flow on a radiator's performance. But what about Water Flow Rate? Well, most (high end - not entry level LC systems) liquid cooling loops today circulate fluid above 1 GPM. What's interesting is that the radiators thermal resistance is pretty constant above 1 GPM. All that means is that you can just choose one specific flow rate (I've chosen 1.5 GPM in this example) to have a very simple way to compare radiators! On top of that you also get to see the influence of Air Flow on each radiator.
Don't hesitate to ask me your questions or just leave a comment
here.
Tab 2
11/25/2011: Apogee HD Vs. RayStorm
This week I received the XSPC RayStorm water block and tested against our Apogee HD. For those who are not familiar with our testing procedure, we used an MCR320-Drive radiator with an MCP35X @ 100%, 1/2" ID tubing, three GT1850 fans at 1850 RPM. Our radiator is equipped with three temperature probes to measure the Inlet Air Temperature in front of each fan. About 4" down our pump's discharge we use a temperature probe that measures the coolant temperature. Using DAQ equipment we monitor and record these temperatures and automatically calculates temperatures deltas between air and average core temperature. [Coretemp is used to log the temperature in a network location - our DAQ equipment and software reads this log to calculate this temperature delta]. We typically do at least 5 mounts for each water block and only the best mount is kept. We do not calculate averages between mounts. Each water block is installed with the same mounting force (180 N).
I spent some time doing additional mounts with a VGA water block in series with both RayStorm and Apogee HD. The idea here is to show the impact of flow rate on each of these two water blocks. Note that there was no GPU actually attached to the VGA water block in order to minimize the variables. This way, we are ONLY seeing the impact of flow rate on the performance of the CPU water block which is precisely what we are trying to assess. As you can see with a "CPU-only" loop there is a small performance difference between the two blocks (.25 C). However, this difference substantially increased (.82 C) as we had the VGA water block. It basically shows that the Apogee HD is much less affected by low flow rates than the RayStorm.
As usual, the devil is in the details! :)
11/16/2011: The Apogee HD 24K Gold Limited Edition
The idea of a Limited Edition water block has been on our minds for years, literally. The Apogee HD was released about 2 weeks now and is currently available in white or black Delrin. But because metal blocks are popular too we want to satisfy all our customers by offering our new Apogee HD with a brass housing. We chose to go with a 24K Gold Plating that offers a unique Gold/Black look which is directly inspired from our logo and brand colors. No ETA or MSRP yet but we should post this information should be available very soon! As usual your feedback is welcome. More information on
XS.
10/09/2011: Apogee HD Vs. XT and others
Tab 3
4/26/2011: After-market tops comparison for MCP350, 355, 35X series and "real life" working Flow Rates
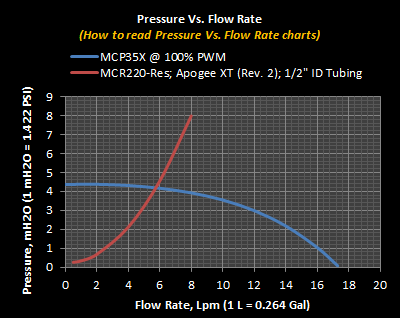
I would like to talk about the Pressure Vs. Flow Rate charts for pumps, and how to read/use them.
A lot of you are probably already familiar with; it is an easy way to estimate the flow rate at which a system runs. For this, we need the specifications of all the components in the system. First, we trace the pump Pressure Vs. Flow Rate chart. Second, we add up the pressure drop for each component (radiator(s), water block(s), tubing, reservoir, etc.) and then we trace the Pressure Vs. Flow Rate chart of the sum of these components. Now, if this has been done right, we should see two curves that intersect. The flow rate at which this intersection occurs is a good estimate of this system actual Flow Rate.
The chart on the left shows the Pressure Vs. Flow Rate curves for the MCP35X pump (@ 100% PWM) and for the systems based on: MCR220-Res, Apogee XT (Rev. 2) and 1/2" ID Tubing. This chart also shows the two curves intersecting at 5.8 Lpm (or ~ 1.5 Gpm) which represents a pretty good estimate of what the actual system flow rate is.
At this point you could ask yourself, is this loop more a low restriction type, or a high restriction type? If you are looking at the X axis you see that the 5.8 Lpm is pretty far from the maximum 18 Lpm that the MCP35X “could” discharge based on maximum specifications… so you are probably thinking this system is most likely quite restrictive. Unfortunately this could not be farther from the truth. In reality, this system is more of a “mid-range” type, actually it could even probably be considered a “low restriction” type as we will see below.
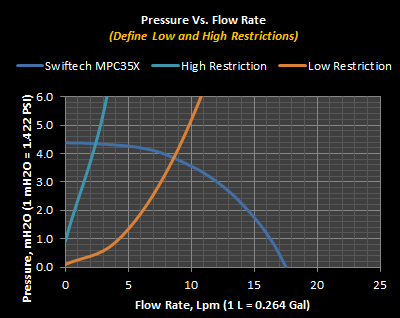
And this brings us to the point I am trying to make. How in effect can we qualify what a “high restriction” or a “low restriction” loops are? The answer to this question is simple and just needs a little bit of imagination: think of a wide range of liquid cooling parts; build up the most and least restrictive loops you can imagine. Swiftech has been in business for long enough to be able to have produced enough low and high restriction parts to choose from, so let's pick among them to build our imaginary loops:
“Low Restriction” loop: one Apogee (original!) CPU water block, one MCR120-Res, four feet of ½" ID tubing.
“High Restriction” loop: one Storm CPU water block and one MCW80 water block in series, with two MCR320-QP, one MCRes-Micro, eight feet of 3/8” ID tubing.
Now that we have defined our standards for “Low” and “High” let's trace the pump PQ curve and see where the flow intersect.
What the chart shows is the relatively small range of flow rates that are typical of an average liquid cooling systems. This range varies from 2 to 9 Lpm (or 1/2 to 2.5 Gpm). This represents less than half the maximum flow rate the pump could achieve!
When comparing pumps, especially when comparing after market tops for the MCP350, 355, 35X series it is very important to keep this range in mind. Because having a pump that can have a maximum discharge of 5 Gpm really doesn’t matter if it cannot keep up in this actual flow rate range. It tends to be overlooked way too often and I thought it was good to put things back in prospective.
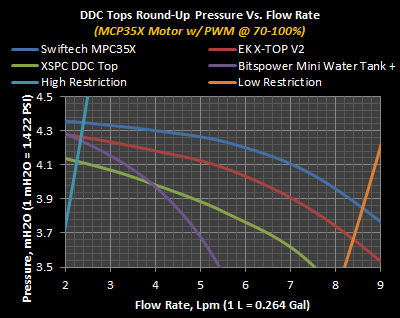
We will finish this article with two aftermarket top comparisons for the MCP350, 355, 35X series zoomed in the actual flow rate range. The chart below compares four different aftermarket tops in the actual flow rate range. And HERE is the data from Skinneelabs.com enhanced through the 0.5-2.5 Gpm range.
While both charts concur on the curves, the range of operations that I am presenting here sheds a more realistic view of the practical performance that can be expected from the various pump tops.
I will conclude this article with a few words on the actual comparison data for this round-up: Throughout the whole range of "real life" working flow rates, the MCP35X top will provide greater pressure than the best three competitors' products. Greater pressure means greater flow rate on any given liquid cooling loop.
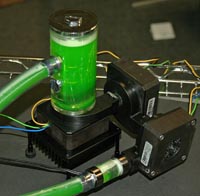
4/21/2011: Six Swiftech MCP35X's... Stacked!
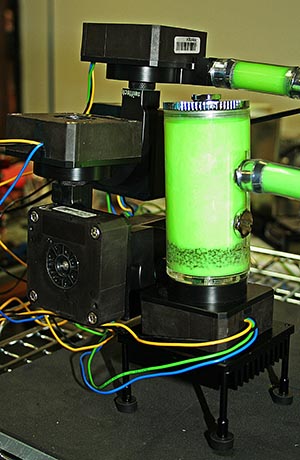
Pretty shocking huh? No, Gabe, this is not a Christmas Tree!
This "assembly" is a stack of
six MCP35X in series. Let's clarify some things first: yes, it is pretty useless. I am sure you all understand that the idea was
to demonstrate how easy to stack several MCP35X in series without using any piece of tubing (but just standard G1/4" couplings!).
But because I am very, very curious I still wanted to test it. So, I've ran it through some of our test-specific liquid cooling loops, and it was able to circulate fluid at close to 3 GPM on our most restrictive loop (for reference, on that specific test a single
MCP35X would only do about 1 GPM).
Don't get too excited though! I did the same test with only three MCP35X and this "more reasonable assembly" was able to circulate water at about the same rate! Serializing pumps usually improves flow rates enough to benefit from it especially on high heat load systems (where the added heat from the pumps are small enough compared to the total system heat load). But there are obvious diminishing returns you really want to avoid.
All in all,
it is very easy to mechanically couple a
MCP35X with another (or more)
MCP35X. Even more amazing, these stacks of 3 and 6 were balanced! At Swiftech we've always liked to be able to combine and recombine products. Now if you have an
MCP35X and you are thinking of getting a dual-pump setup you have the option to do so with just one standard G1/4" coupling.